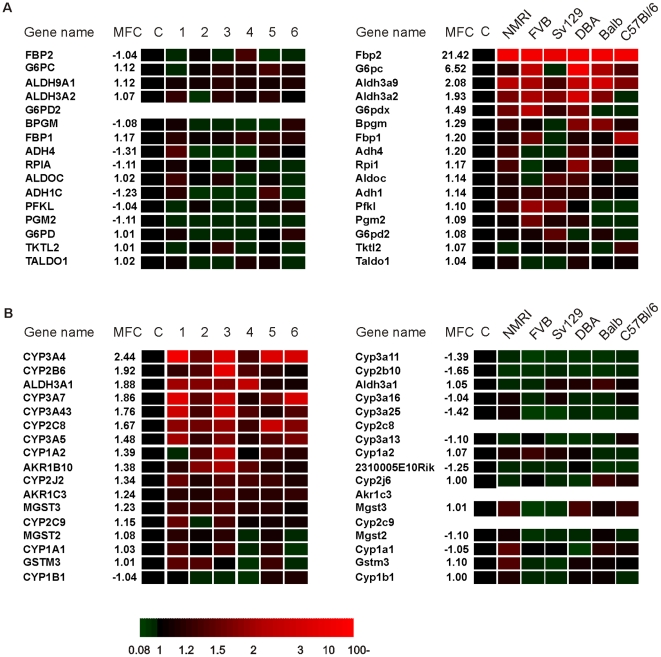
Figure 4. Heat map illustrating the species-specific regulation of two gene sets originating from Gene set enrichment analysis (GSEA).
(A) Glycolysis-gluconeogenesis as a mouse-specific upregulated gene set. (B) Xenobiotic metabolism as a human-specific upregulated gene set. Genes are ranked based on the mean fold change (MFC). Expression levels in the DMSO-treated cells were set at 1.

