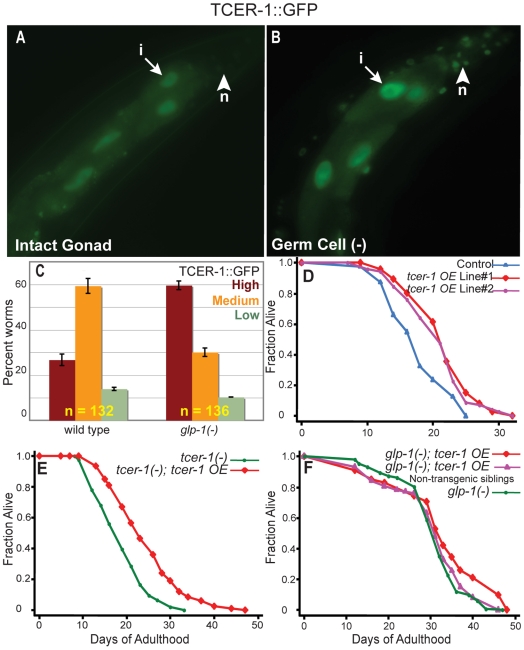
Figure 3. TCER-1 expression is elevated upon germline ablation and tcer-1 overexpression increases the lifespan of wild-type animals.
(A–C) Elevation of TCER-1::GFP levels following germline removal using laser ablation (A,B) or glp-1 mutantions (C). (A,B) TCER-1::GFP expression in day 1 adults of control worms with intact gonads (A), and germ-cell precursor (Z2, Z3)-ablated worms (B). Increased expression is visible in intestinal nuclei (‘i’) and neurons (‘n’) (compare arrows and arrowheads, respectively, between (A) and (B)). (C) Bar graph showing increased TCER-1::GFP expression in sterile, long-lived glp-1 mutants. Day 1 adults of each strain were classified into those with High (red bars), Medium (orange bars), and Low (green bars) GFP levels (focusing primarily on the intestine). ‘n’ signifies the total number of worms examined in two trials. Error bars represent the standard error of the mean. (D) Effect of tcer-1 overexpression on the lifespan of intact, wild-type animals. Wild-type control carrying only the co-injection marker (Podr-1::rfp): m = 17.4±0.4, n = 81/89. TCER-1::GFP, tcer-1 OverExpressing strains (tcer-1 OE), Line #1: m = 21.2±0.4, n = 85/90, P vs. control<0.0001; Line #2: m = 21.6±0.6, n = 74/79, P vs. control 0.0002. (E) Effect of tcer-1 overexpression on the lifespan of tcer-1 mutants. tcer-1(−): m = 18.6±0.4, n = 91/108; tcer-1(−); tcer-1 OE: m = 24.6±0.8, n = 81/106, P<0.0001. tcer-1 overexpression in a tcer-1(−) background produced a greater lifespan extension than tcer-1 overexpression in tcer-1(+) background. For example, in the above experiment, tcer-1 overexpression in a tcer-1(−) background produced a 33% lifespan extension as compared to 14% in a tcer-1(+) background (note the difference in X-axis scale between A and B). The reason for this difference is unclear, but it is similar to the trend exhibited by another longevity-promoting transcription factor, SKN-1 [68]. (F) Effect of tcer-1 overexpression on the lifespan of glp-1 mutants. glp-1(−): 30.6±0.2, n = 102/104. glp-1(−); tcer-1 OE: m = 30.4±0.3, n = 82/89, P vs. glp-1(−) 0.3. glp-1(−); tcer-1 OE non-transgenic (wild-type) siblings: m = 30.6±0.2, n = 86/89, P vs. glp-1(−) 0.4, P vs. glp-1(−); tcer-1 OE = 0.2. See Table S2 for results with additional transgenic lines and multiple repeats of above experiments.

