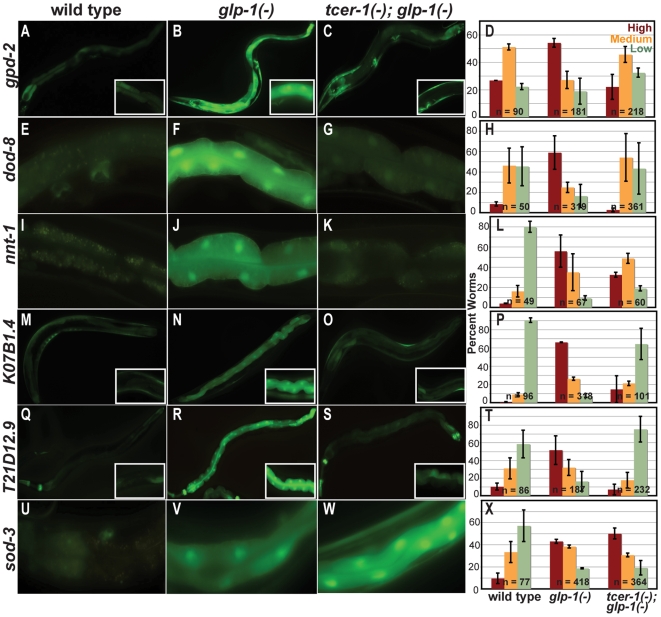
Figure 4. tcer-1 is required for the up-regulation of DAF-16/FOXO-target genes in glp-1 mutants.
(A–X) Expression of DAF-16/FOXO-target genes in wild-type worms (left column), glp-1 mutants (middle column), and tcer-1; glp-1 mutants (right column). Animals were observed on day 2 of adulthood using transcriptional GFP reporters for individual genes. Bar graph representation of the data for each gene is shown in the far-right column. In each experiment, worms were classified into those with High (red bars), Medium (orange bars), and Low (green bars) GFP levels. ‘n’ signifies the total number of worms examined in two or three trials. Error bars represent the standard error of the mean. The elevated expression observed in glp-1 mutants was reduced in the case of gpd-2 (A–D), dod-8 (E–H), nnt-1 (I–L), K07B1.4 (M–P) and T21D12.9 (Q–T). Expression of sod-3 was elevated further (U–X). In (A–C), (M–O), and (Q–S), images were observed at 200× magnification. The insets in these panels show intestinal cells of the same strains imaged at 400×. In (E–G), (I–K), and (U–W), images of intestinal cells were observed at 400×. For more information about the expression patterns of these genes, and other DAF-16/FOXO-targets, see Table S3.

