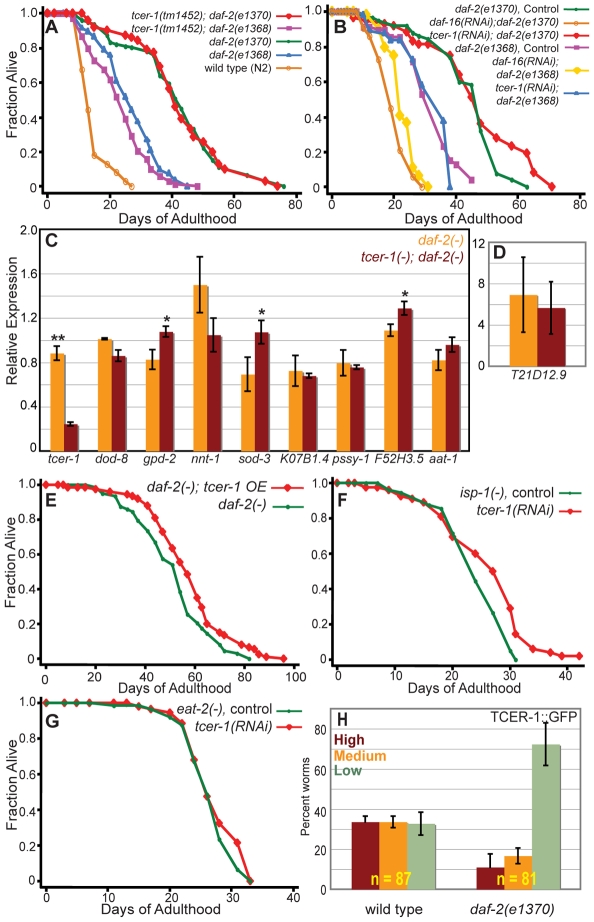
Figure 6. tcer-1 reduction of function does not suppress the extended lifespans of other longevity mutants.
(A) Effect of tcer-1(tm1452) on longevity of daf-2(e1370) and daf-2(e1368) mutants. Lifespan of daf-2(e1370): m = 47.2±0.7, n = 91/103; tcer-1(tm1452); daf-2(e1370): m = 46.6±0.6, n = 58/102, P = 0.43. daf-2(e1368): m = 33.1±0.4, n = 75/103; tcer-1(tm1452); daf-2(e1368): m = 31.3±1.8, n = 57/100, P = 0.1. N2: m = 16.7±0.1, n = 70/113. (B) Effect of tcer-1 RNAi on longevity of daf-2(e1370) and daf-2(e1368) mutants. Lifespan of daf-2(e1370) mutants grown on bacteria containing empty control vector (m = 45.6±1.5, n = 58/77), daf-16 RNAi bacteria (m = 16.2±0.1, n = 45/73, P vs. control<0.0001), and tcer-1 RNAi bacteria (m = 47.5±2.0, n = 45/63, P vs. control = 0.12). daf-2(e1368) mutants grown on bacteria containing empty control vector (m = 31.0±1.3, n = 47/76), daf-16 RNAi bacteria (m = 19.7±0.4, n = 35/69, P vs. control<0.0001) and tcer-1 RNAi bacteria (m = 32.0±0.8, n = 41/75, P vs. control = 0.54). (C,D) tcer-1(tm1452) does not suppress the up-regulation of DAF-16/FOXO-target-genes in daf-2(e1370) mutants. mRNA levels of DAF-16/FOXO-regulated genes were compared between daf-2(e1370) mutants (orange bars) and tcer-1(tm1452); daf-2(e1370) mutants (red bars). Day 1 adults grown under similar conditions were tested by Q-PCR analysis. The data shown here are combined from three independent biological replicates, each comprising 2–4 technical repeats. Genes tested are displayed on the X-axis and relative expression levels are on the Y-axis. Error bars display standard error of the mean. The asterisks represent a change in expression between the two strains that have a P value<0.01 (*) or <0.005 (**) using an unpaired, two-tailed t-test. The expression of T21D12.9 has been depicted in a separate panel (D) in the interest of clarity, as this gene is expressed at higher levels than the others. (E) Effect of tcer-1 overexpression on the lifespan of daf-2(e1370) mutants. daf-2(−): m = 51.2±1.5, n = 63/87; daf-2(−); tcer-1 OE: m = 57.6±1.4, n = 74/90, P = 0.01. See Table S2 for additional trials of this experiment. (F) Effect of tcer-1 RNAi on longevity of isp-1(qm150) mutants. Lifespan of isp-1(qm150) mutants grown on bacteria containing empty control vector (m = 24.1±0.5, n = 39/91) and tcer-1 RNAi bacteria (m = 26.1±0.5, n = 52/90, P vs. control = 0.0005). See Table S5 for multiple repeats of the lifespan experiments shown above. (G) Effect of tcer-1 RNAi on longevity of eat-2(ad1116) mutants. Lifespan of eat-2(ad1116) mutants grown on bacteria containing empty control vector (m = 26.5±0.4, n = 59/72) and tcer-1 RNAi bacteria (m = 27.2±0.5, n = 40/71, P vs. control 0.2). (H) Expression of tcer-1 in daf-2(e1370) mutants. Bar graph showing reduced TCER-1::GFP expression in long-lived daf-2(e1370) mutants. Day 1 adults of each strain were classified into those with High (red bars), Medium (orange bars), and Low (green bars) GFP levels (focusing primarily on the intestine). ‘n’ signifies the total number of animals examined in two trials. Error bars represent the standard error of the mean.

