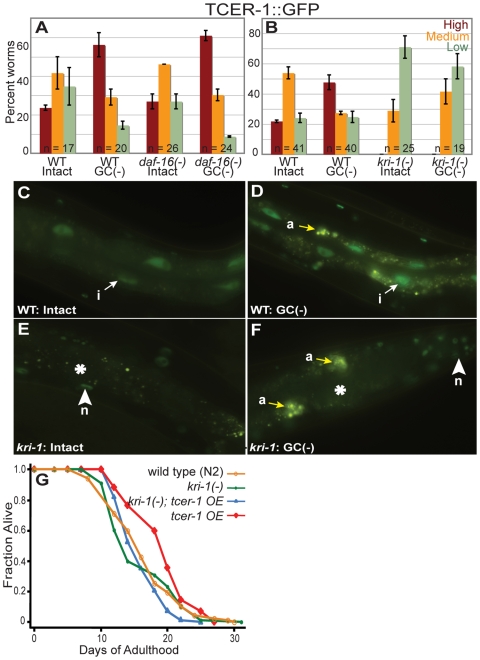
Figure 7. TCER-1 expression is elevated upon germline ablation in a daf-16-independent and kri-1-dependent fashion.
(A) TCER-1 up-regulation does not require daf-16. Bar graph showing increased TCER-1::GFP levels in animals with germline-precursor cells (Z2, Z3)-ablated in a wild-type background (WT) or in daf-16(mu86) mutants. Day 1 adults of each strain were classified into those with High (red bars), Medium (orange bars), and Low (green bars) GFP levels (focusing primarily on the intestine). ‘n’ signifies the total number of animals examined in two trials. Error bars represent the standard error of the mean. (B–F) Intestinal TCER-1 levels are influenced by kri-1. TCER-1::GFP expression observed in day 1 adults of wild-type control (WT) worms (C,D) with intact gonads (C), and following germ-cell precursor (Z2, Z3)-ablation (D). Increased expression in intestinal nuclei (i) is visible (compare white arrows between (C) and (D)). Images of age-matched intact (E) or germline-ablated (F) kri-1(ok1251) mutants are shown. In both cases, there is drastic reduction in intestinal GFP (asterisks). In some trials, we observed a small increase in the cytoplasmic GFP levels in intestinal cells following germline ablation, but this was not quantifiable due to the strong reduction in overall GFP signal in the intestine. Autofluorescence (a) in intestinal cells is indicated by yellow arrows. kri-1(ok1251) did not alter TCER-1::GFP in any other tissues such as neurons (n, arrowheads). Bar graph of data shown in (C–F) is depicted in (B) (key and experimental set up same as in (A)). (G) Lifespan extension produced by tcer-1 overexpression requires kri-1. N2: m = 16.5±0.3, n = 90/138; kri-1(ok1251): m = 15.9±0.2, n = 69/135, P vs. N2 = 0.19; tcer-1 OE: m = 20.5±0.4, n = 97/130, P vs. N2 = <0.0001, P vs. kri-1(ok1251)<0.0001; kri-1(ok1251); tcer-1 OE: m = 16.0±0.5, n = 79/128, P vs. N2 = 0.54, P vs. kri-1(ok1251) = 0.46, P vs. tcer-1 OE<0.0001. See Table S4 for multiple repeats of this experiment.

