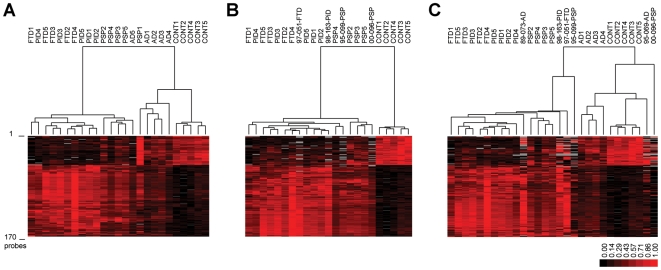
Figure 2. Analysis of original and new samples using the refined microarray data set.
Figure 2A. Clustering of all 25 samples using the refined dataset of 166 probes. Figure 2A. Clustering of selected 23 samples and new PSP, FTD and PiD disease samples. Figure 2C. Clustering of selected 23 samples and new PSP, FTD and PiD - and Alzheimer's disease samples. Sample names are as in Figure 1.

