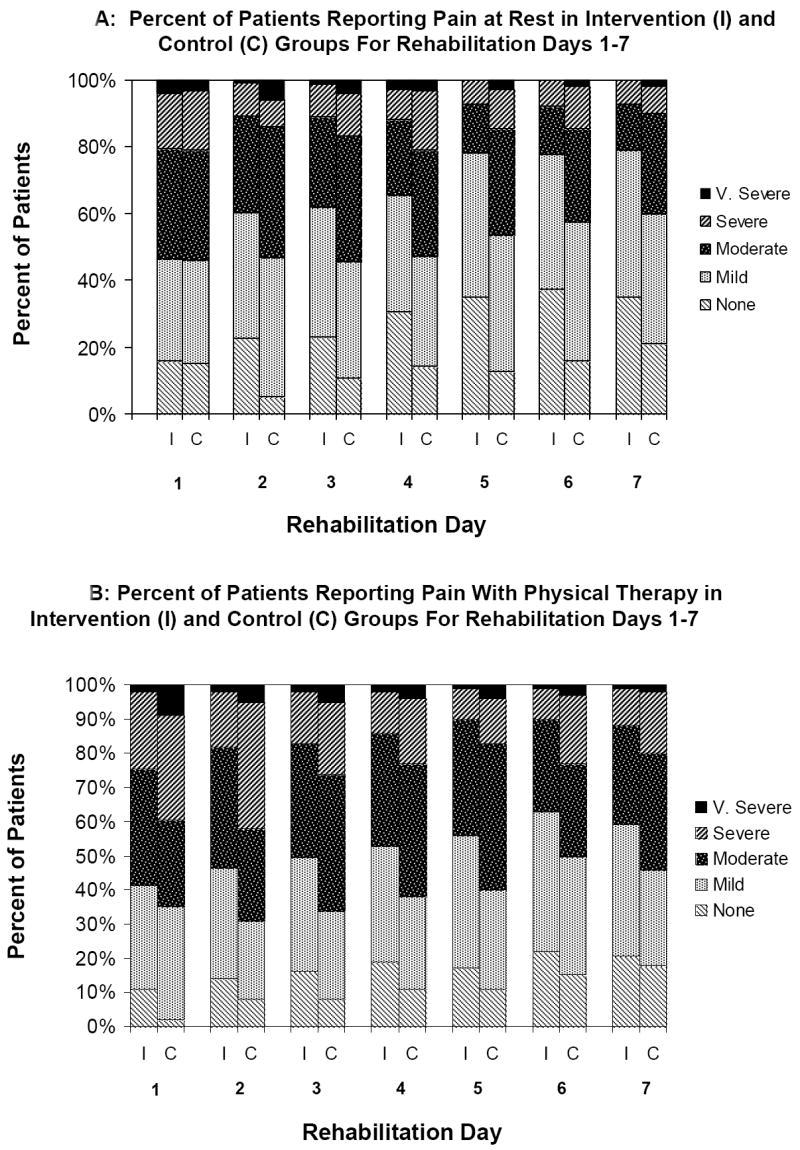
Figure 2.

Pain at rest (Figure 2A) and pain with PT (Figure 2B) for intervention and control patients for intervention and control patients from rehabilitation day 1 to rehabilitation day 7. Overall adjusted mean pain at rest scores from admission through day 7 were 2.2 (95% CI 2.14 to 2.30) for intervention patients and 2.6 (2.46 to 2.63) for control patients (parameter estimate = -.33; 95% CI -.52 to -14; P<.001). Overall adjusted mean pain scores during PT for rehabilitation days 1-7 were 2.6 (2.48 to 2.65) for intervention patients and 2.8 (2.72 to 2.91) for control patients (parameter estimate = -.20; -.34 to -01; P=.04). All values reflect propensity score matched normalized weighted data.
