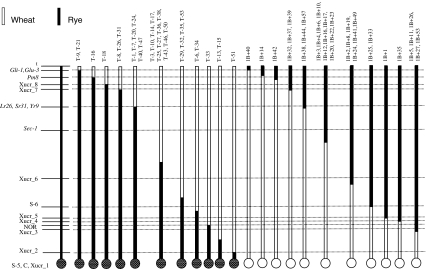
Fig. 2.
Diagrammatic representation of genetic positions of recombinant breakpoints of 1RS-1BS in Pavon 76 bread wheat. White bars are representing wheat 1BS and black bars represent rye 1RS. On the left side of the figure is the list of markers present starting from the centromere at the bottom (represented by circle; white = wheat and black = rye centromeres) to the top toward telomeres. Each black and white bar represents the 1RS-1BS arm showing the position of the markers with respect to recombinant breakpoints and these bars represent only the 40% distal end of the chromosome

