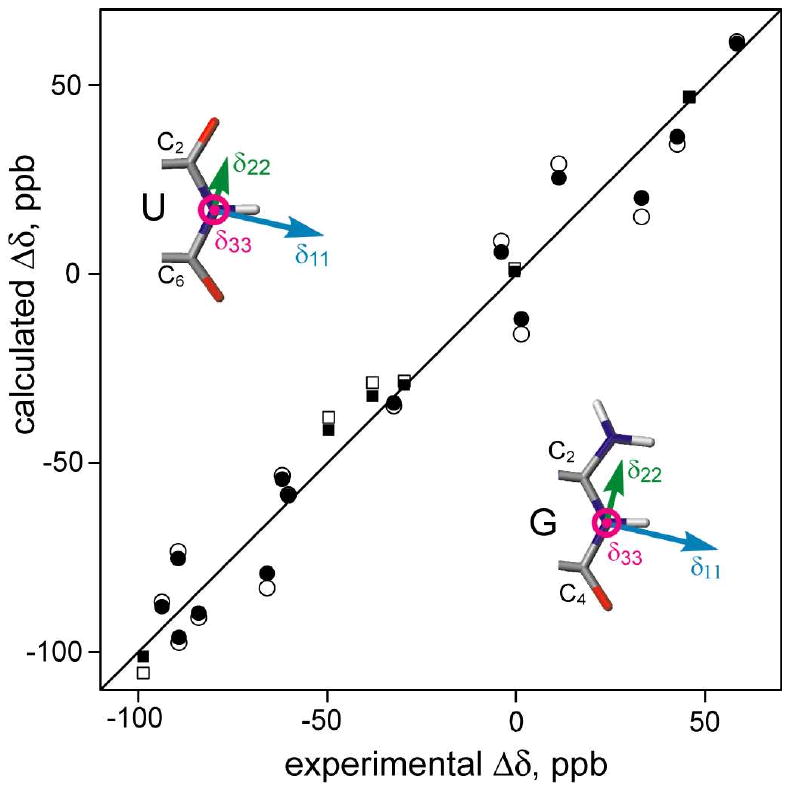
Figure 2.

Correlations between the experimental and predicted Δδ(15N). Filled symbols correspond to Δδ values for a CSA tensor optimized with all nucleotides of a given type (circles for G:N1; squares for U:N3) included in the CSA fit. Open symbols represent jack-knifed cross-validation results, where each (predicted/observed) pair is shown for a CSA tensor obtained without using the experimental data of that nucleotide.
