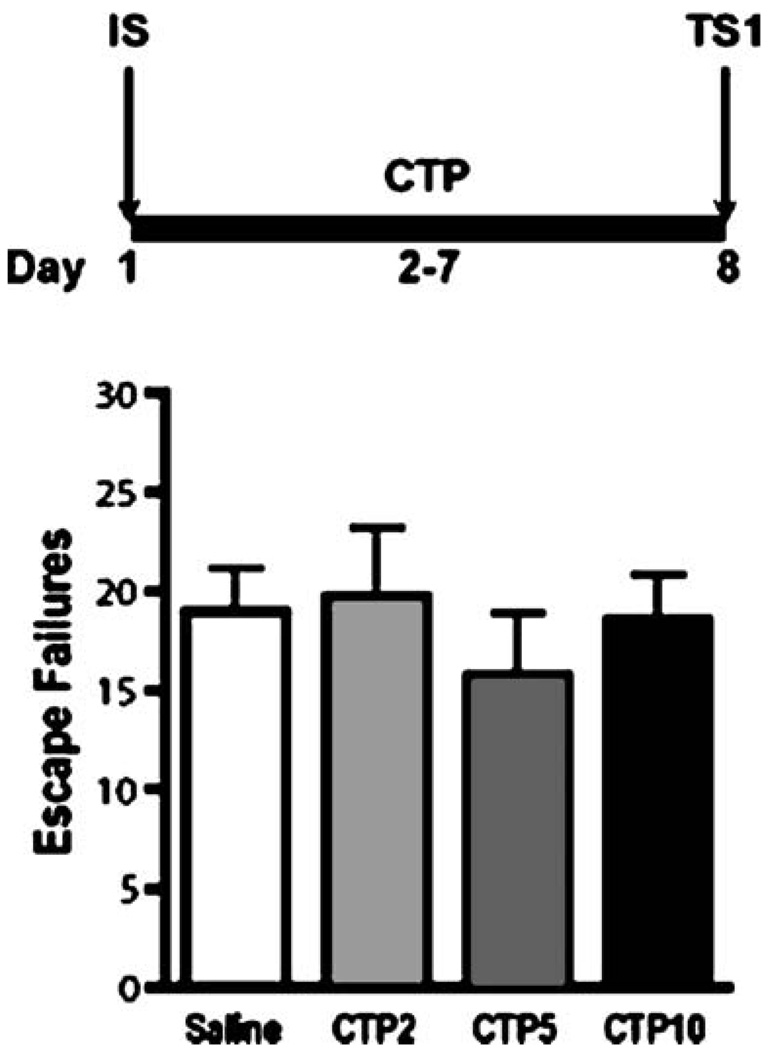
Fig. 4.
Dose-response of citalopram (CTP) at first shuttle box test. The bold line represents the period of drug administration after IS. Data are expressed as group mean escape failures±SEM (n=7–15 per group). No significant differences were detected between groups treated with SAL or CTP (2, 5, or 10 mg/kg/day)

