
FIGURE 1. The area of reduced glucose metabolism in the subgenual PFC is illustrated in images composed of voxel t-values that compare depressives and controls, shown in sagittal (left) and coronal (right) sections1,2.
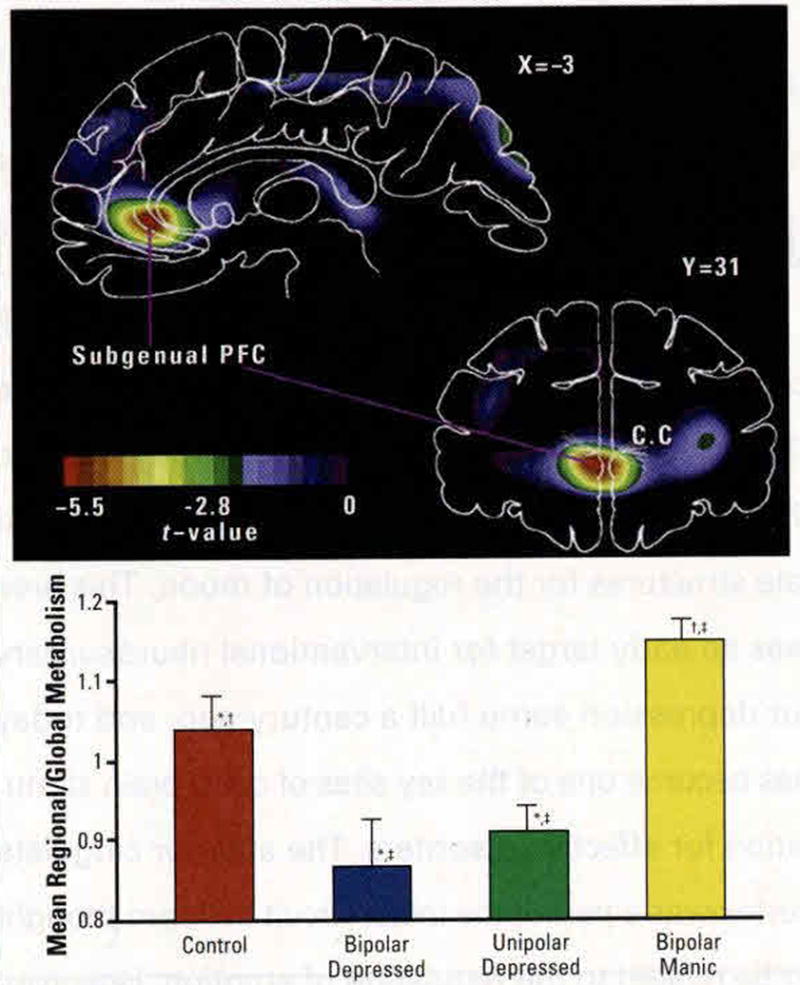
This image was produced by a voxel-by-voxel computation of the unpaired t-statistic2 to identify inherent differences in metabolism between samples of familial bipolar and unipolar depressives relative to healthy controls.1 The t-images shown were generated to provide optimal localization of a regional metabolic abnormality identified using other techniques, which included comparisons involving independent subject samples,1 The negative t-values, shown in a coronal section at 31 mm anterior to the anterior commissure (y=31 mm) and a sagittal section at 3 mm left of the midline (x=−3 mm), correspond to areas where metabolism is decreased in the depressives relative to the controls. Both the stereotaxic center-of-mass of the peak metabolic difference shown here (x=−2, y=32, z=−2; interpreted as in Table 1) and that of the peak blood flow difference computed in an independent subject set(x=1, y=25, z=−6) localized to the agranular region of the anterior cingulate gyrus ventral to the corpus callosum. The mean normalized metabolism for each group is shown from Drevets and colleagues.1 However, the area of reduced metabolism in the sgACC was at least partly accounted for by a corresponding reduction in cortex in both the bipolar disordered and the unipolar depressed groups relative to the control group (Figure 3). While the spatial resolution of PET precludes clear laterality distinctions in midline structures, the MRI-based neuromorphometric measures showed the grey matter volume reduction to be left-lateralized. Anterior is to the left and dorsal toward the top.
* P<.025, control versus depressed.
† P<.05, control versus manic.
‡ P<.01, depressed versus manic.
PFC=prefrontal cortex; CC=corpus callosum; SgACC=subgenual anterior cingulate cortex; PET=positron emission tomography; MRI=magnetic resonance imaging
Drevets WC, Price JL, Simpson JR Jr, et al. Subgenual prefrontal cortex abnormalities in mood disorders. Nature. 1997;386:824–827.
Mazziotta JC, Phelps ME, Plummer D, Kuhl DE. Quantitation in positron emission computed tomography, 5. Physical—anatomical effects. J Comput Assist Tomogr. 1981;5:734–743.