
FIGURE 3. Mean (±SEM) MRI-based volumes of the left sgACC gray matter differed between the bipolar disordered, unipolar depressed, and control groups4.
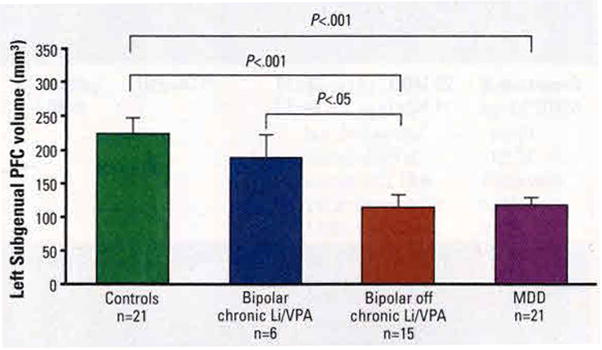
The left subgenual PFC/whole brain volume ratio also was reduced in the bipolar and unipolar groups relative to the control group. Although the bipolar subjects who underwent PET imaging had been unmedicated prior to scanning, additional bipolar subjects were included in the MRI portion of the study who had been chronically medicated with lithium (n=4) or divalproex (n=2). The mean volume for this medicated subsample is shown separately, and differed significantly (P<.05) from both the unmedicated bipolar disorder and MDD groups, but did not differ significantly from the healthy control group.
SEM=standard error of the mean; MRI=magnetic resonance imaging; sgACC=subgenual anterior cingulate cortex; PFC=prefrental cortex, Li/VPA=lithium/divalproex; MDD=major depressive disorder; PET=positron emission tomography.
Drevets WC, Price JL, Simpson JR Jr. et al. Subgenual prefrontal cortex abnormalities in mood disorders. Nature. 1997;386:824–827.