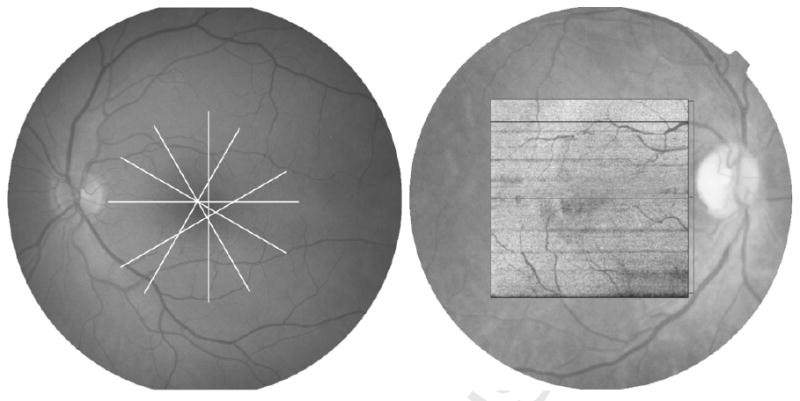
Figure 2.

Fourier domain (FD)-OCT (top left) and Time domain (TD)-OCT (top right) images from the same eye. The external limiting membrane (ELM) was marked on each OCT B-scan (middle left) + (middle right) where clearly visible using the Pencil tool from Adobe Photoshop. ELM was visible across 77% of the FDOCT scan (bottom left) in contrast to 59% of the TDOCT scan (bottom right) from the same eye.
