
Figure 3.
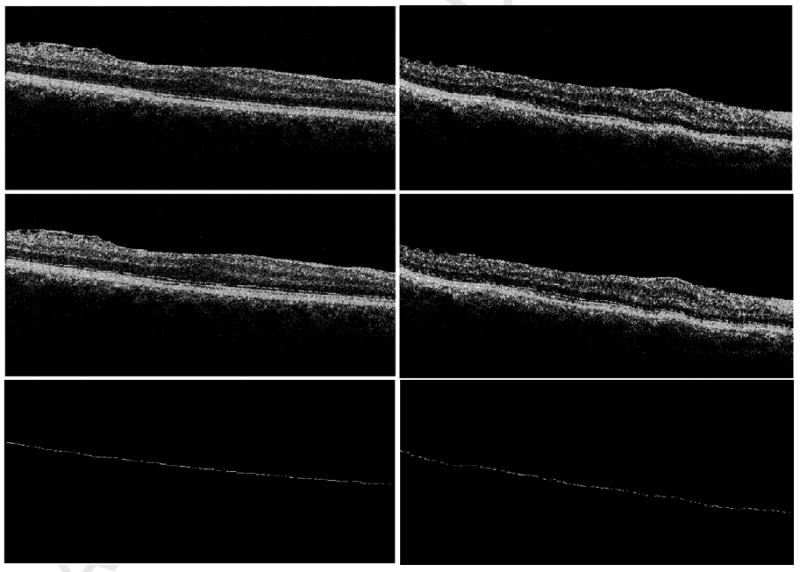
Time domain (TD)-OCT (first row) and Fourier domain (FD)-OCT (second row) B-scans showing subfoveal photoreceptor outer segment disruption (white box). TDOCT (third row) and FDOCT (fourth row) B-scans showing more widespread disruption (white box).