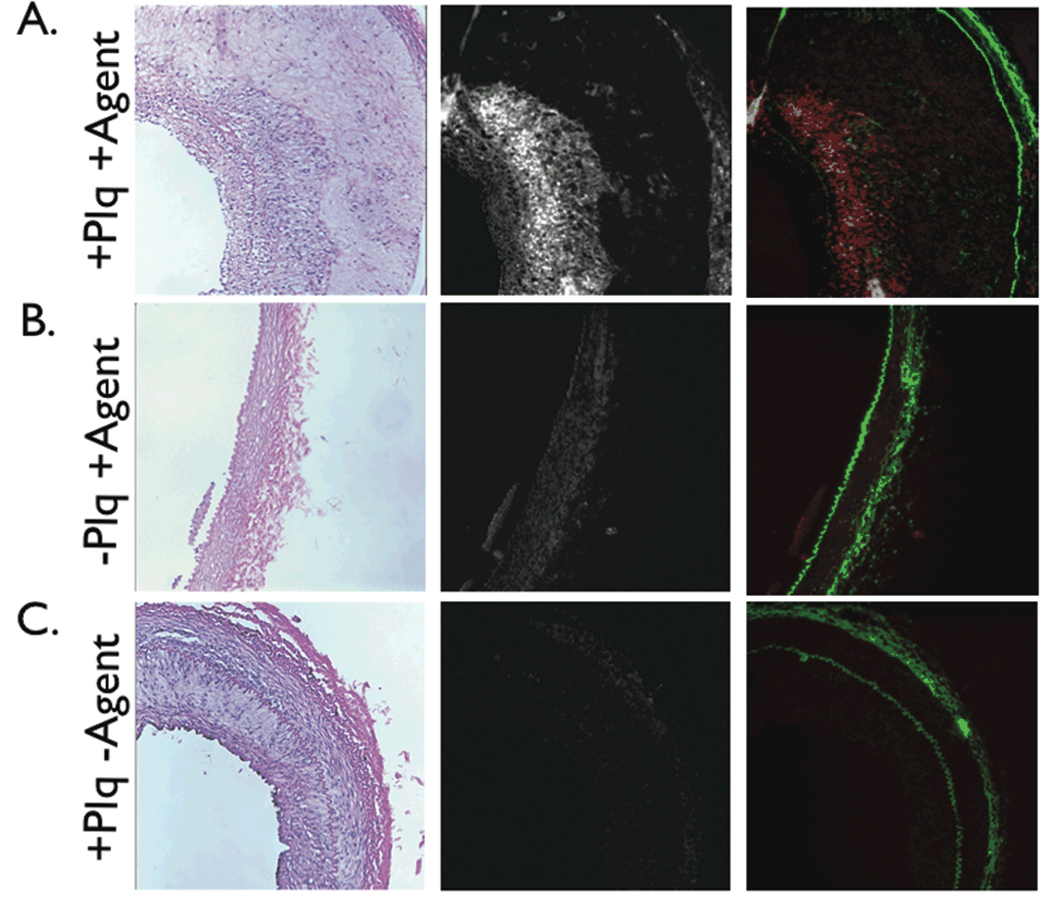
Figure 7.
Correlative histopathology and fluorescence microscopy of representative arterial sections. Left, H&E ×100; middle, NIR fluorescence microscopy ×100; right, two-channel merged NIR fluorescence (red) and elastin autofluorescence (green) ×100. (A) In plaque sections from the protease agent group, abundant NIRF signal colocalized with cell-rich areas of plaques, (B) but not in the normal vessel wall. (C) In plaque sections from the control group, negligible NIRF signal was detected, consistent with the in vivo and ex vivo NIRF imaging results. NIRF images windowed identically.

