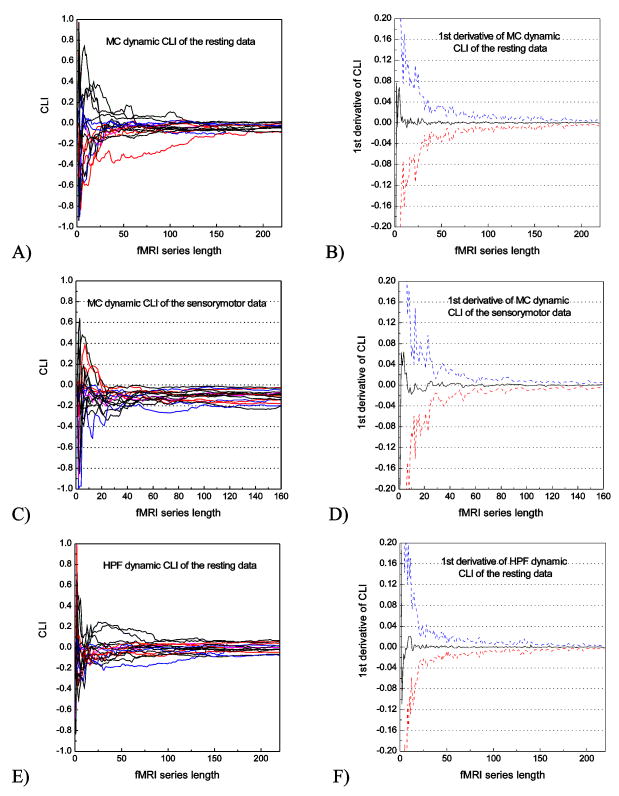
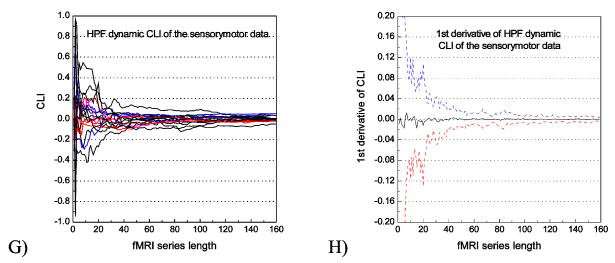
Figure 2.
CLI temporal convergence curve and its 1st derivative calculated from the resting fMRI data and the sensorimotor fMRI data using MC and HPF ROIs. Each plot in A, C, E, G represents data from a particular subject. In B, D, F, H, the black line represents the mean 1st derivative; and the blue, red dashed lines indicate the + standard deviations of the 1st derivative.


