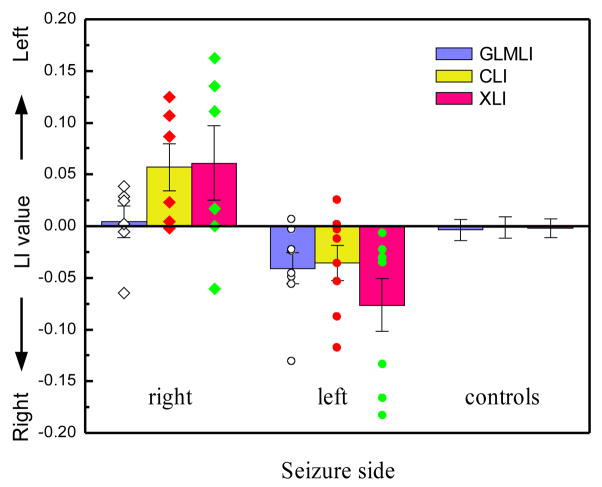
Figure 5.
Error bars of GLMLI, CLI, and XLI for the epileptic patients and normal controls calculated from the scene-encoding fMRI data within HPF. The “right” and “left” unilateral epilepsy patient groups are subdivided according to their side of seizure. “controls” means normal healthy subjects. The scattered points overlapped on the bars are LIs of the right (diamonds) and the left sided patient group (circles).

