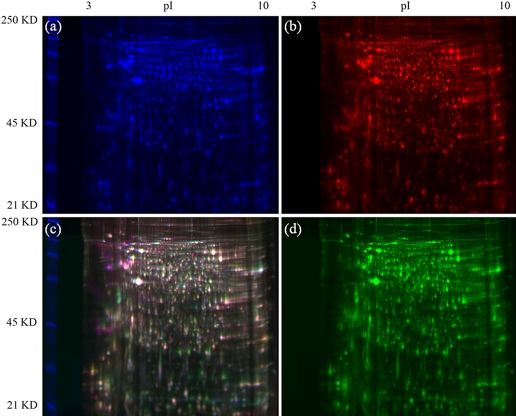
FIGURE 5.
A comparison of aphid proteins extracted using the TCA-acetone, phenol, and multi-detergent extraction techniques using 2-D DIGE. Genotype F protein (50 μg) was labeled accordingly: TCA-acetone labeled with Cy2 (a), multi-detergent labeled with Cy5 (b), phenol labeled with Cy3 (d), and a merged image of all three channels (c). The gel was visualized using the Typhoon Variable Mode Imager Model 9400 (GE Healthcare). Analyzing the different extraction samples on the same gel eliminated differences in the spot patterns that might be a result of isoelectric focusing and/or gel-to-gel variation and highlights differences in the protein extracts, as can be seen by the presence of the individual Cy-labeled proteins in the merged image.

