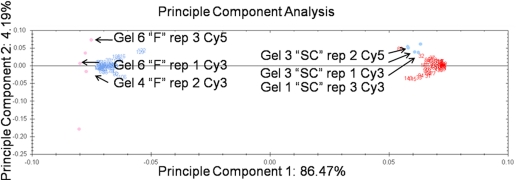
FIGURE 8.
PCA of the TCA-acetone-extracted aphid proteins DIGE assay. The first principle component corresponds to the different genotypes used in the experiment. The second principle component largely corresponds to gel-to-gel variation. Spots up-regulated in the F genotype are shown in blue, spots up-regulated in the SC genotype are shown in red. Gel samples with F TCA-acetone extraction technical replicates are shown in pink circles clustered near the F up-regulated spots. Gel samples with SC technical replicates are shown in blue circles clustered near the SC up-regulated spots. One Cy-Dye-labeled technical replicate is labeled on the graph to demonstrate how these replicates cluster along the y-axis. As these spots spread along the y-axis, the second principle component explains the variation as a result of technical issues (4.19%). Thus, the TCA-acetone extraction method itself contributes little overall variation to the experiment and is an extraction method suitable for a quantitative 2-D DIGE analysis.

