Figure 5.
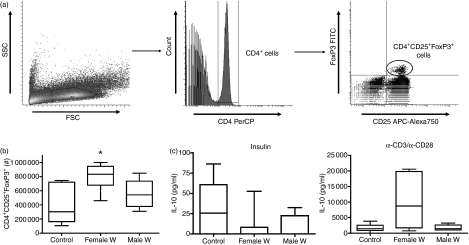
(a) Gating strategy for flow cytometric identification of regulatory T cells. Lymphocytes were gated by forward-scatter (FSC) and side-scatter (SSC) characteristics (left panel). CD4 peridinin chlorophyll protein (PerCP)-positive lymphocytes were gated (middle panel) and analysed for CD25 allophycocyanin (APC) -Alexa750 positivity and FoxP3 fluorescein isothiocyanate (FITC) positivity (right panel). (b) Total numbers of spontaneous splenic CD4+ CD25+ FoxP3+ regulatory T cells and (c) interleukin-10 (IL-10) production of insulin (middle panel) or α-CD3/α-CD28 (right panel)-stimulated spleen cell cultures from sham-treated controls (n= 11) or mice that were intraperitoneally implanted with five female (n= 7) or male (n= 5) adult worms. Significant differences between groups were analysed by the Kruskal–Wallis test, followed by Dunn’s post-hoc multiple comparisons. Significant differences are shown between infected mice and controls (*P < 0·05). Combined data from two independent experiments are shown.

