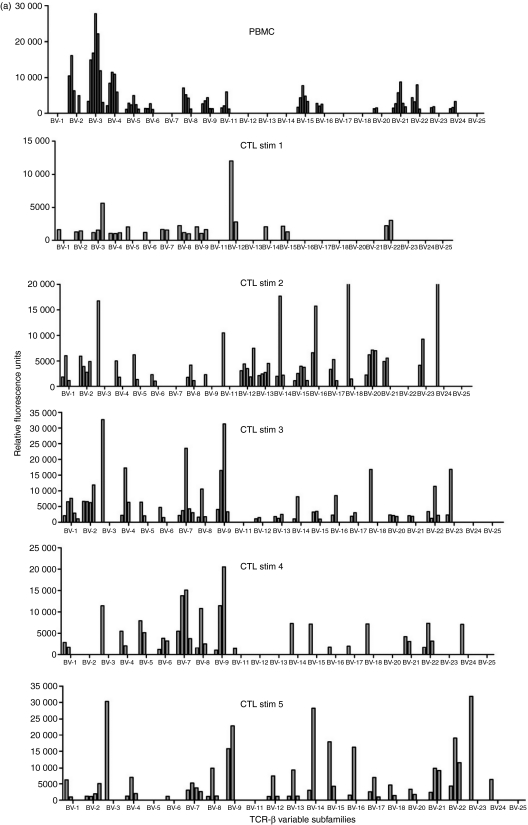
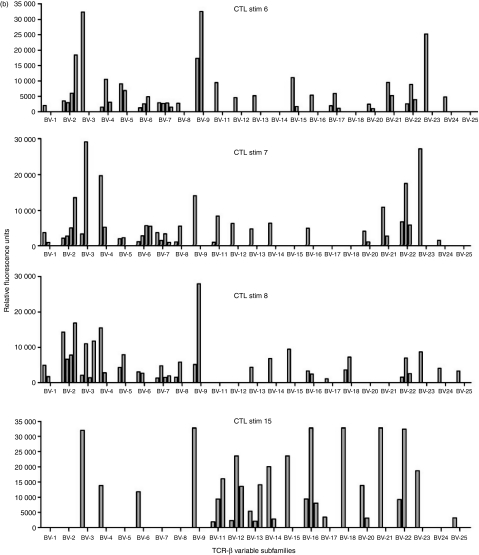
Figure 2.
T-cell receptor (TCR) variable β subfamily usage by one cytoxic T lymphocyte (CTL) cell line determined over time by spectratyping analyses. Each of the 23 subfamilies was analysed for polyclonal (more than two major peaks) and clonal (one or two major peaks) distribution patterns. PBMC, peripheral blood mononuclear cells; Stim, number of stimulations with autologous lymphoblastoid cell line.


