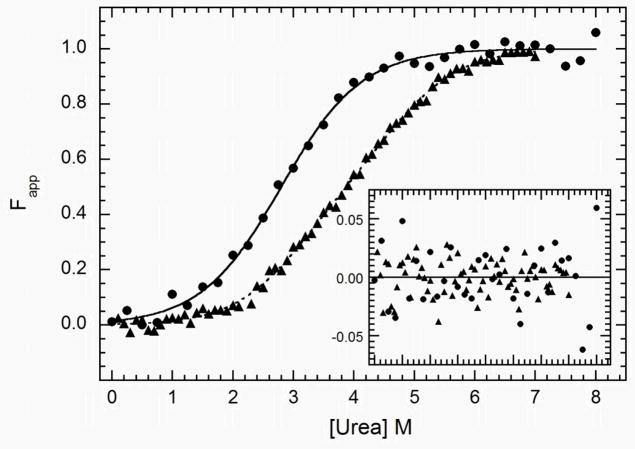
Figure 3.
Analysis of the stability of dsRBM1 and dsRBD by equilibrium urea unfolding titrations. Samples were prepared at 0.1 mg/ml (dsRBM1) or 0.15 mg/ml (dsRBD) and incubated at variable urea concentrations at 20°C for 3 hours. CD data were collected at 222 nm in a 5 mm path length cuvette. The data were background-subtracted, normalized and fit with a two-state model (dsRBM1) or a three-state model (dsRBD) using the program SAVUKA. The points are the normalized data for dsRBM1 ( ) and dsRBD (
 ). and the lines are the respective two- and three-state fits. The inset shows the residuals. The best-fit parameters are in Table 1.

