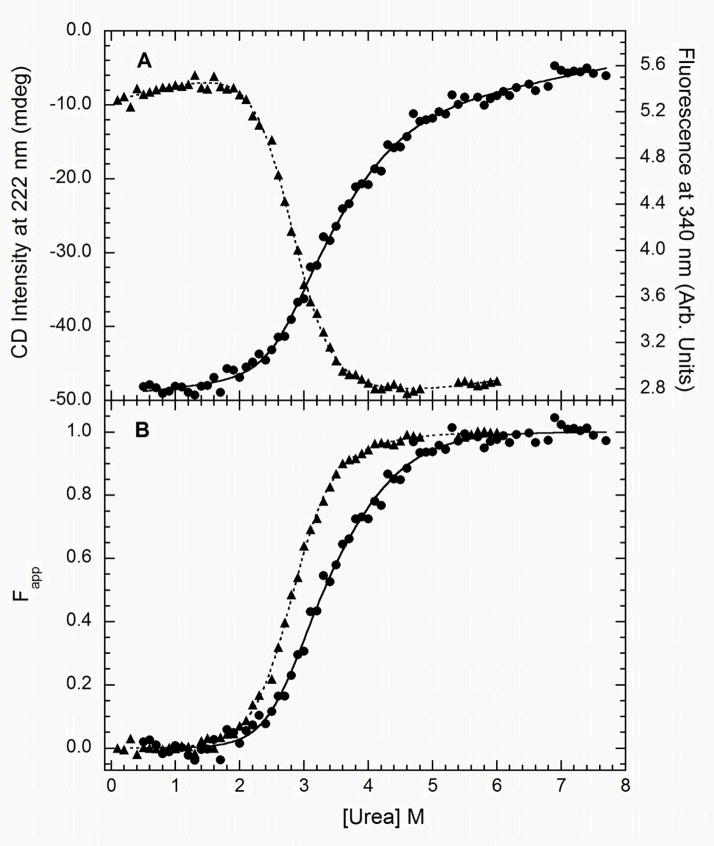
Figure 4.
Analysis of the stability of the kinase domain. Samples were prepared at 0.15 mg/ml and variable urea concentrations and incubated at 20°C for 3 hours. Unfolding was monitored using CD at 222 nm ( ) and tryptophan fluorescence emission with excitation at 295 and emission at 340 nm (
 ). A) Raw data. B) Background subtracted and normalized data. The lines are the global fit of the CD and fluorescence data to a three-state model obtained using SAVUKA.

