
Figure 4.
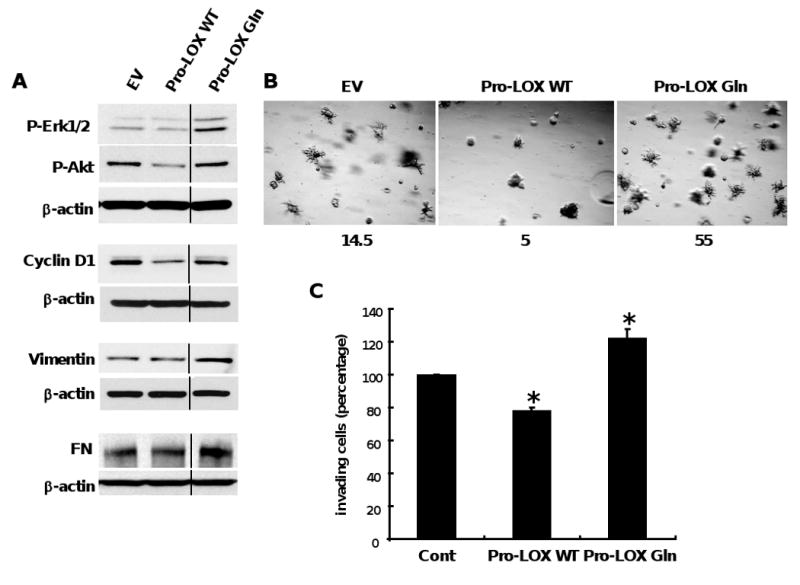
The G473A polymorphism impairs the ability of Pro-LOX to inhibit transformed phenotype. A, NF639-EV, -Pro-LOX WT, -Pro-LOX Gln cells were starved, stimulated and analyzed as in Fig. 2A. Quantification of this and two duplicate experiments indicate that the Pro-LOX WT and Pro-LOX Gln compared to EV DNA (set to 1.0), respectively gave values for phospho-Erk1/2 of 0.91 ± 0.03 and 2.41 ±1.20; phospho-Akt of 0.68 ± 0.10 and 0.98 ± 0.07; cyclin D1 of 0.71 ± 0.32 and 0.97 ± 0.27; vimentin of 1.01 ± 0.02 and 1.61 ± 0.54; and fibronectin (FN) of 0.91 ± 0.16 and 1.44 ± 0.36. B, Cells were subjected to Matrigel outgrowth assay as described in Fig. 2C. Total colonies and colonies with branching structures were counted across 9 images/sample at 50 × magnification. Numbers below represent percentage of branching colonies/total colonies from two independent experiments. C. Cells were subjected to Matrigel invasion assay as in Fig. 2D. Pro-LOX WT significantly reduced cell invasion (*, P = 2.0 e-5) whereas Pro-LOX Gln significantly increased invasion of these cells (*, P = 0.002). Data for the average invasion from three independent experiments relative to vehicle control (set at 100%) ± SD are presented.