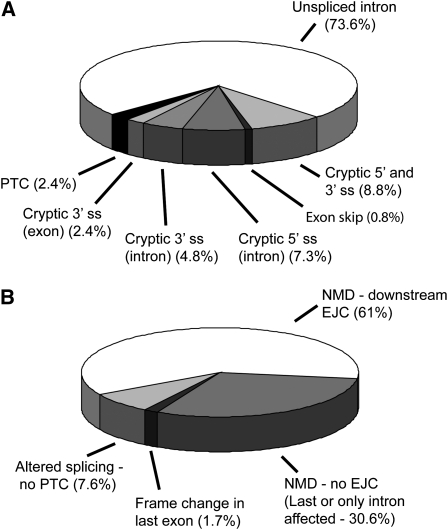
Figure 3.
Distribution of Splicing and NMD Transcript Phenotypes.
(A) Distribution of different splicing phenotypes among 160 aberrantly spliced transcripts from the three cDNA libraries.
(B) Distribution of transcripts by potential consequence of the aberrant splicing event(s). NMD phenotypes were classified as potential NMD substrates with or without a downstream EJC, or non-NMD substrates where no PTC is generated or where the PTC remains close to the 3′ UTR due to a frame change in the last exon. ss, splice site.

