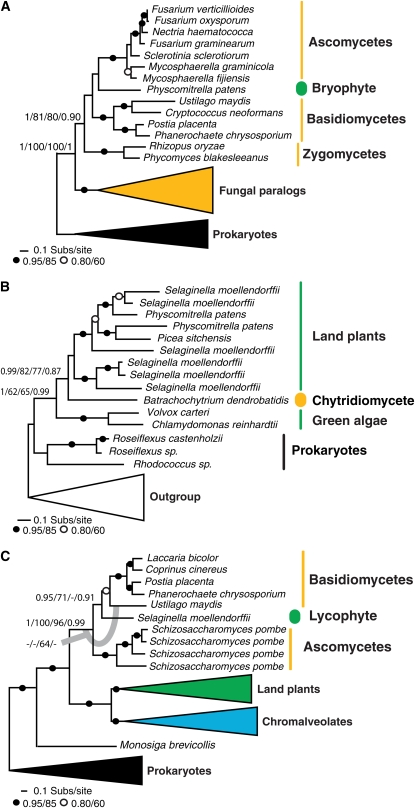
Figure 1.
Phylogenetic Evidence for Plant-Fungi HGT.
Results of phylogenetic analyses of three candidates for which the tree topology results support a case for HGT between plants and fungi. All phylogenies are reduced versions of the full tree topologies (see corresponding Supplemental Figures 1 to 3 online for full details). Black dots are used when the relevant node is supported with 85% or more bootstrap support by both bootstrap methods. Open circles show cases when both bootstrap results are between 60 and 84%. For key nodes, actual support values are marked in the order Bayesian posterior probability/PhyML bootstrap/RAxML bootstrap/PhyML node-by-node SH test. Fungi groups are marked in yellow and plants in green. The transferred genes are marked by thick and colored ovals. Nonformal and nonequivalent higher taxonomic names are labeled on each phylogeny.
(A) Phylogeny of the putative l-fucose permease sugar transporter.
(B) Phylogeny of the putative zinc binding alcohol dehydrogenase.
(C) Phylogeny of the putative major facilitator superfamily membrane transporter.

