Figure 2.
Phenotype Analysis of CKI1-Overexpressing Plants.
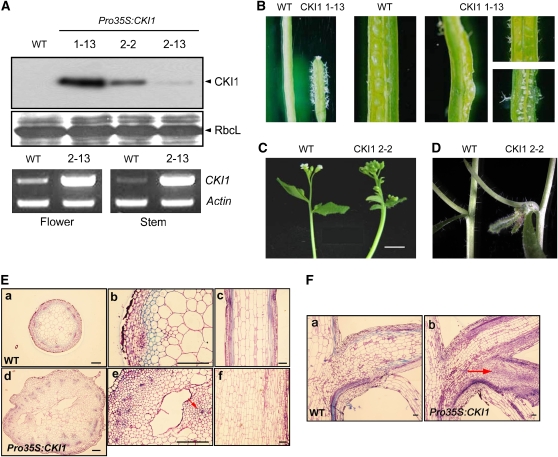
(A) Expression analysis of Pro35S:CKI1-HA transgenic lines. Total protein and RNA from 2-week-old wild-type and transgenic plants were subjected to an immunoblot assay (top) and RT-PCR assay (bottom). RbcL and actin serve as input controls in the two assays.
(B) and (C) Ectopic expression of CKI1 leads to sterility, many trichomes (B), and thick fasciated inflorescence stems (C).
(D) Ectopic expression of CKI1 leads to additional vegetative tissues initiated from lateral meristems.
(E) The architecture of VBs in Pro35S:CKI1 transgenic plants. Transverse sections ([a], [b], [d], and [e]) and longitudinal sections ([c] and [f]) of the inflorescence stems of wild-type (top) and Pro35S:CKI1 transgenic plants (bottom). The arrows indicate ectopically formed VBs.
(F) The node structures of wild-type and Pro35S:CKI1 transgenic plants. Longitudinal sections of wild-type (a) and Pro35S:CKI1 transgenic nodes (b). The arrow indicates an ectopic axillary bud in a Pro35S:CKI1 transgenic plant.
Bars = 100 μm.

