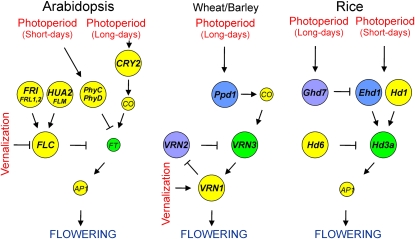
Figure 1.
Gene Networks Involved in Natural Variation for Flowering Responses to Vernalization and Photoperiod signals in A. thaliana, Wheat, and Rice.
Diagrams do not represent full molecular models of flowering regulation, but they show gene network components and branches known to contribute to the natural intraspecific variation existing in these species. Yellow color represents genes that contribute to the variation in a single species, which do not present known homologous genes contributing to natural variation in other species. Green color depicts homologous genes that contribute to the variation in several species. Blue and purple indicate genes accounting for the variation in one species, which show homologous protein domains with genes contributing to the variation in another species. Given their large functional homology, CO, FT, and AP1 homologs of the three species are included in the three diagrams, with small circles depicting genes that do not contribute to natural variation. See text for further details.

