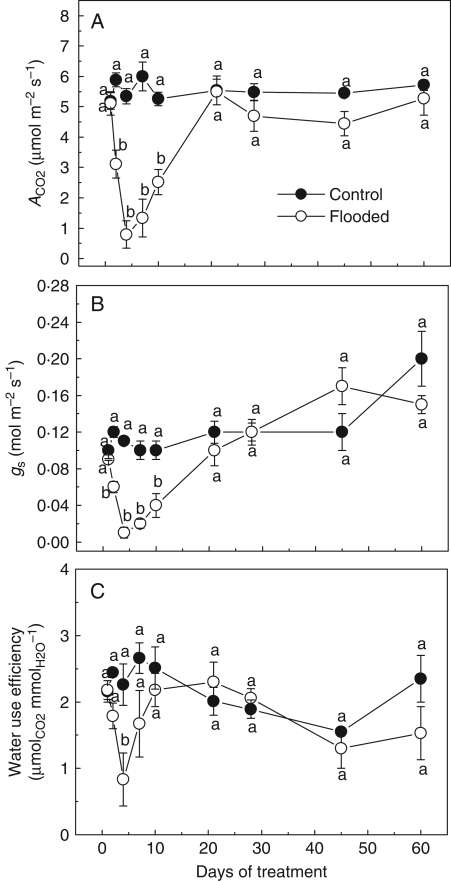
Fig. 1.
Photosynthetic rates (ACO2), stomatal conductance (gs) and water use efficiency (WUE) in Erythrina speciosa under control and flooding conditions. Data are expressed as the mean ± s.e.; n = 4 leaves per treatment, each leaf from a different individual. Different letters indicate a significant difference between means (P < 0·05 %; Tukey test).

