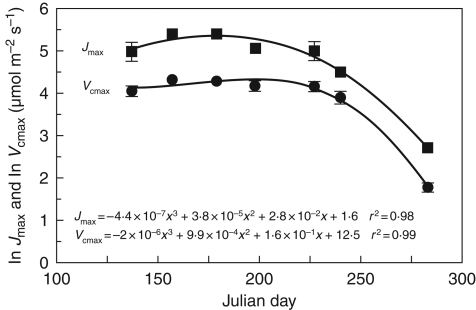
Fig. 1.
Seasonal change in the log-transformed mean maximum electron transport rate (Jmax) and the log-transformed mean maximum carboxylation rate (Vcmax) for five species of deciduous trees grown under optimal conditions. The solid lines are non-linear third-order polynomial regression curves fitted to the seasonal data set (r2 = 0·98, Jmax; r2 = 0·99, Vcmax), where the spread within a day is the natural log of species variation ± s.e.

