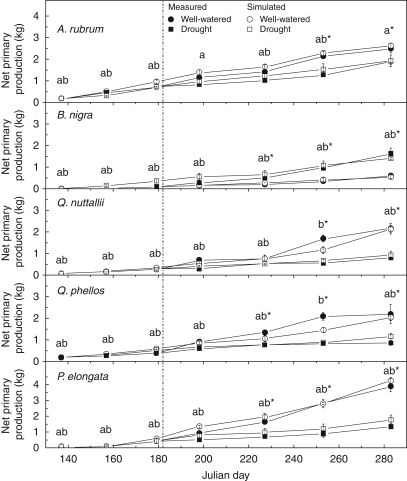
Fig. 3.
Measured versus modelled net carbon accumulation throughout the study period. Solid symbols represent well-watered (circles) and drought treatment (squares) measured values and open symbols represent simulated well-watered (circles) and drought treatment (squares) net carbon accumulation. Data are the mean of three trees per harvest date ± s.e. ‘a’, no significant difference between modelled and measured data in the well-watered treatment at α = 0·05; b, no significant difference between modelled and measured data in the drought treatment at α = 0·05; *, a significant treatment effect between measured data at α = 0·05. The dashed line indicates the start of the drought treatment (Julian day 181).

