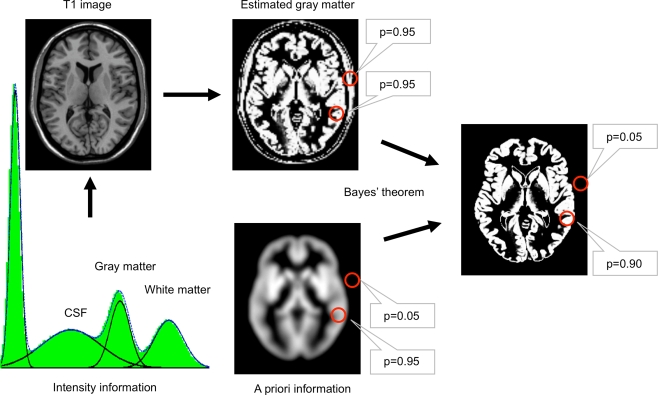
Figure 1.
Image segmentation using a priori information. In the first step, the image intensities of the T1 image (upper left) are used to plot their frequencies in a histogram. Several peaks – corresponding to different image intensities of the tissue classes – can be differentiated. In the next step, gaussian curves for each tissue class are fitted into the histogram to estimate the probability of a voxel belonging to that tissue class (bottom left). A map for gray matter is shown (upper right) with the estimated probability for two selected locations (red circles). Based solely on a similar image intensity, the cerebral and the extracranial spot exhibit a similar probability for belonging to gray matter. This can be corrected by combining the image intensity-based information with prior information (below), e.g. using a Bayesian approach.

