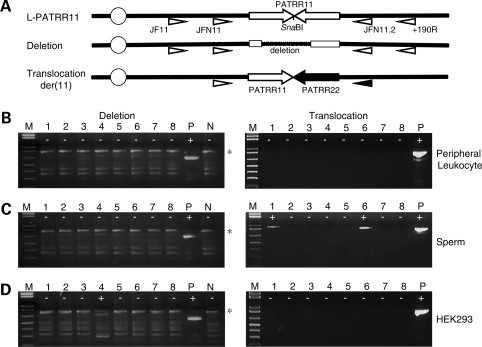
Figure 1.
Detection of de novo deletions and translocations by polymerase chain reaction (PCR). (A) Location of PCR primers. Arrows indicate each arm of the PATRR11 (white arrows) and the PATRR22 (black arrows). Deletion of the PATRR11 was detected by PCR amplification with primers (white triangles) designed on the region flanking to the PATRR11 after digestion of the template DNA with SnaBI. Translocations can be detected using one of the primers flanking the PATRR11 paired with one of the primers flanking the PATRR22 (black triangle). The centromere of chromosome 11 is represented as a circle. (B) Results of deletion-specific nested PCR (left panels) and translocation-specific PCR (right panels) of peripheral blood leukocyte DNA. (C) PCR results of sperm DNA. (D) PCR results of HEK293 cell lines. The largest bands correspond to the PCR products derived from an intact L-PATRR11 (775 bp, asterisk). Background bands observed in all of the lanes are partially or completely denatured molecules of the same PCR product. ‘Plus’ indicates positive PCR reactions, while ‘minus’ indicates negative reactions. M, size markers (1 kb ladder plus); P, positive controls; N, negative controls.

