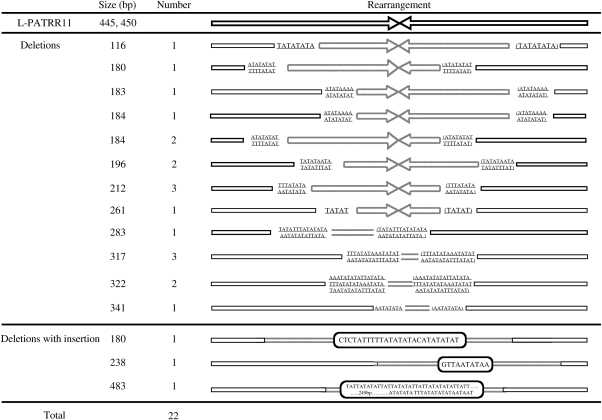
Figure 3.
Analysis of breakpoints of de novo deletions. Arrows indicate each arm of the PATRR11. Upper panel represents simple deletion. Dotted line depicts deleted regions. The nucleotides on the arrows indicate identical nucleotides at both of the proximal and distal breakpoints within the PATRR11. The nucleotides at the distal breakpoints are also shown in brackets. Lower panel represents deletions with insertion. The nucleotides in the boxes are the inserted sequences of unknown origin. Two deletions are not listed here since proximal breakpoints are located at AT-rich region just upstream of the PATRRs.

