Figure 4.
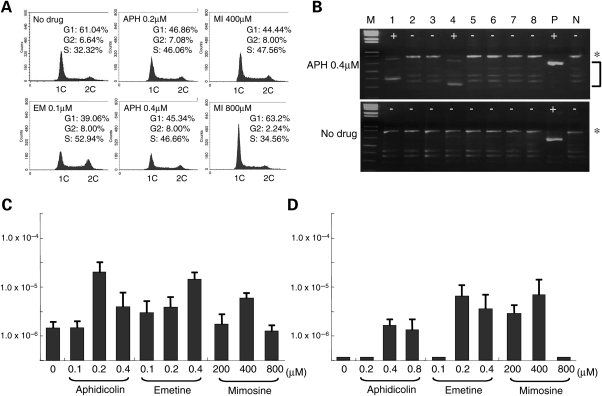
Partial inhibition of DNA replication by administration of inhibitors of DNA replication. (A) Histogram showing the DNA content. Horizontal axes indicate fluorescence intensity of propidium iodide, while vertical axes indicate the number of cells. Estimated proportions of cells in each phase of the cell cycle are indicated on the upper right corner. APH, aphidicolin; EM, emetine; MI, mimosine. (B) Results of PCR for de novo deletion. Asterisks indicate the PCR products derived from an intact L-PATRR11, while PCR products derived from de novo deletion are indicated by a bracket. ‘Plus’ indicates positive PCR reactions, while ‘minus’ indicates negative reactions. M, size markers (1 kb ladder plus); P, positive controls; N, negative controls. (C) Frequency of the de novo deletions in HEK293 cells. (D) Frequency of the de novo deletions in PHA-stimulated peripheral lymphocytes. Vertical axes indicate the frequency expressed on a logarithmic scale. All the experiments were repeated three times. Error bars indicate the standard deviation.

