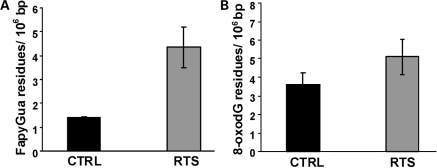
Figure 3.
Endogenous levels of FapyG and 8-oxoG in RTS cells. DNA was isolated from normal control, GM00323 and RTS fibroblasts, AG5013, digested with P1 nuclease and alkaline phosphatase, then analyzed by GC-MS for FapyG (A) or 8-oxoG (B) as described in Materials and Methods. Values indicated are modified residues per 106 bases.

