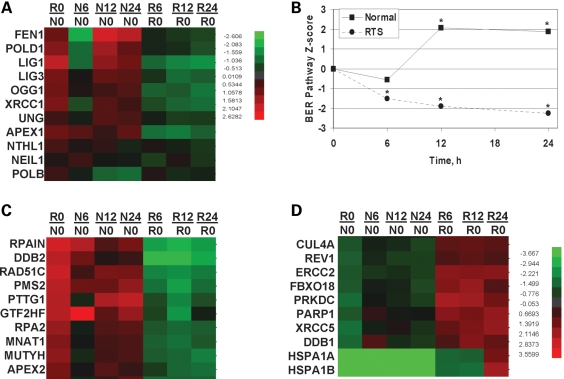
Figure 8.
BER pathway analysis of microarray data. (A) Clustering of RNA expression patterns for select BER genes observed after no treatment (R0/N0) or after treatment with 25 µM menadione and harvested at 6, 12 or 24 h later. (B) Relative BER pathway gene expression changes for 11 BER proteins, OGG1, NTH1, NEIL1, UNG, APEX1, POLB, POLD, FEN1, LIG1, LIG3 and XRCC1, were analyzed and are displayed. The relative RTS versus normal signal is plotted as a function of the time when the samples were harvested. All points were statistically significant (*) except the 6 h point in the normal cells. A P-value of 0.05 was considered statistically significant. (C and D) Cluster analysis of the top 10 most up- or down-regulated DNA repair genes after menadione treatment. R0/N0, ratio of z-scores of RTS to normal cells. Nx/N0 or Rx/N0, ratio of z-scores of normal (N) or RTS (R) relative to z-score at time zero (N0 or R0), where x represents the time of harvest after menadione treatment, 6, 12 or 24 h.

