
Figure 1.
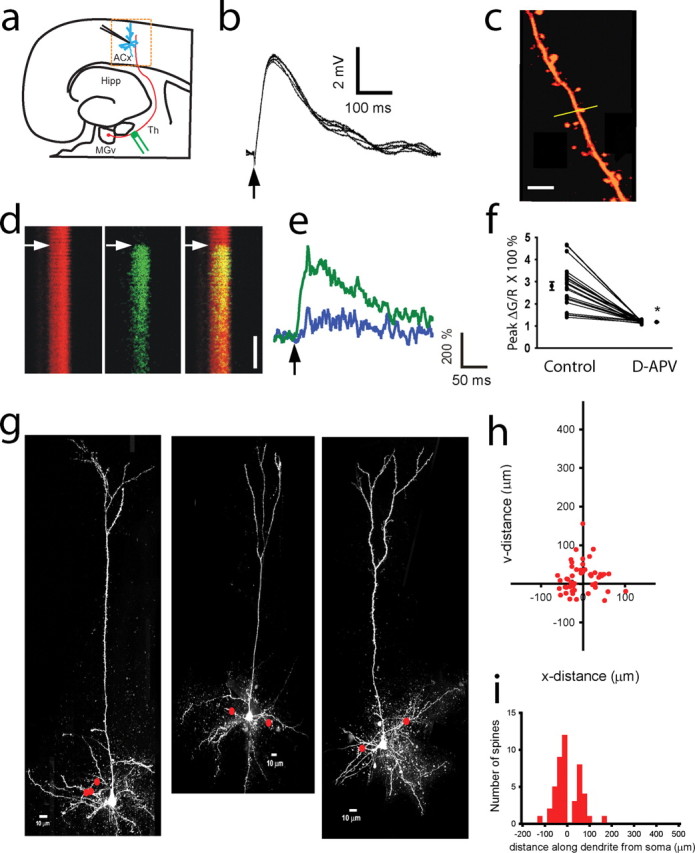
Maps of active thalamocortical inputs on dendritic trees of thalamorecipient pyramidal neurons. a, Diagram of a thalamocortical slice containing parts of the MGv and the ACx. Thalamorecipient pyramidal neurons (blue) are recorded in the ACx. Th afferents (red lines) are stimulated using stimulating electrodes (green). Hipp, Hippocampus. b, Monosynaptic EPSPs recorded in a thalamorecipient neuron in response to a single Th stimulation (arrow). Average EPSP onset latency was 4.2 ± 0.80 ms (mean ± SD), analyzed for 150 representative EPSPs. c, Image of part of a dendritic tree. Line scans (yellow line) are performed across a dendritic spine and parent dendritic shaft. Scale bar, 3 μm. d, Line scans of Alexa 594 (red), Fluo-5F (green), and their overlay (right) in a dendritic spine and shaft in response to a single Th stimulation (arrows). Scale bar, 100 ms. e, Changes in Fluo-5F fluorescent intensity in a dendritic spine (green) and in the parent dendritic shaft (blue) over time in response to a single synaptic stimulation (arrow). f, d-APV (50 μm) eliminates calcium transients in dendritic spines (*p < 0.01, paired t test; n = 24). Filled circles represent mean peak Ca2+ signal (averaged from 5–10 Ca2+ transients) before (control) and after application of 50 μm d-APV. Also shown are means ± SEM calculated from all 24 experiments. g, Alexa 594 reconstructions of three thalamorecipient neurons in the ACx indicating sites where active spines were detected (red dots). h, Composite map of all active Th inputs (n = 46) detected from 31 thalamorecipient pyramidal neurons. Cartesian coordinates represent the placement of Th inputs on a dendritic tree, in which the coordinates of the soma are 0,0. Note that Cartesian coordinates of basal dendritic spines may be in the positive or negative direction on either of the axes, depending on their orientation to the cell soma (as in g). i, Frequency histogram of the distance of all active Th inputs measured along dendrites from the cell soma of thalamorecipient pyramidal neurons. Negative values denote basal dendrites, and positive values denote apical and oblique dendrites.