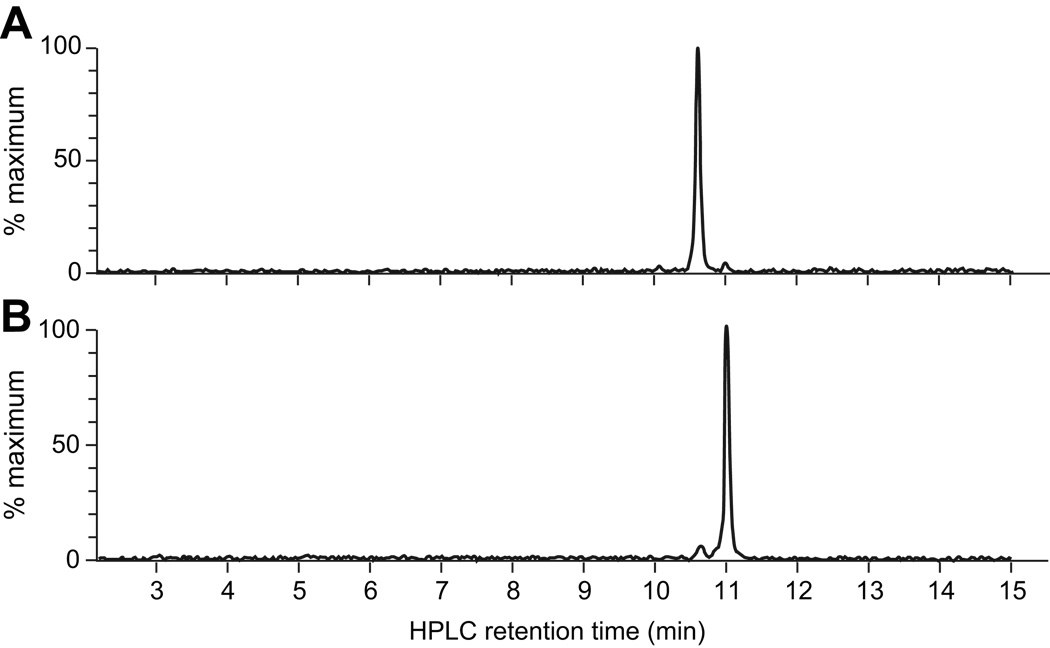
Figure 4.
Extracted ion chromatograms (m/z 1667–1669) from a full MS scan of urine that was obtained after infusion with either the A or B form of huUgn. (a) LC-MS analysis of a urine sample obtained from a huUgnA-infused animal at the end of the peptide infusion (marked by the black arrowhead in Figure 3a). The LC retention time of the prominent peak (10.61 min) corresponds to that of huUgnA, while the LC retention time of the minor peak (10.95) corresponds to that of huUgnB. (b) LC-MS analysis of a urine sample obtained from a huUgnB-infused animal at the end of the peptide infusion (marked by the white arrowhead in Figure 3a). The LC retention time of the prominent peak (10.99 min) corresponds to that of huUgnB, while the LC retention time of the minor peak (10.63) corresponds to that of huUgnA.

