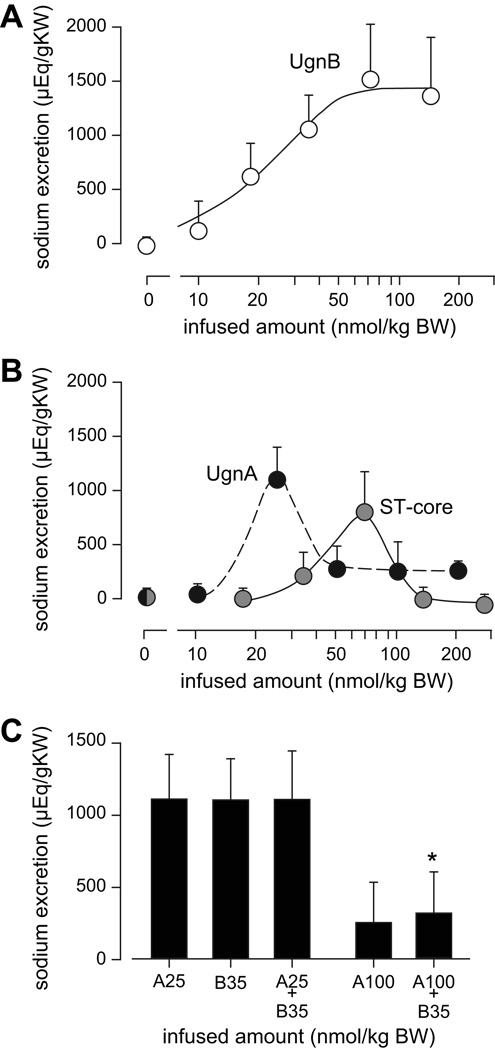
Figure 6.
Dose-dependencies of the renal responses to huUgnA, huUgnB, and ST-core. (a) Net cumulative sodium excretion (total peptide-stimulated output minus corresponding control output) over a three hour period during and after huUgnB infusion, plotted as a function of infused dose. The curve is fitted to a log agonist response curve with an ED50 of 19 nmol/kg. (b) Net cumulative sodium excretion over a 3 hour period during and after infusions of huUgnA (open symbols) or ST-core (filled symbols). The curves were fitted by a cubic spline algorithm. (c) Net cumulative sodium excretion over a three hour period during and after combinatorial peptide infusions. Peptides were infused during the first hour in the following amounts and combinations: A25 = huUgnA 25 nmol/kg; B35 = huUgnB 35 nmol/kg; A100 + B35 = huUgnA 100 nmol/kg combined with huUgnB 35 nmol/kg; A25 + B35 = huUgnA 25 nmol/kg combined with huUgnB 35 nmol/kg. The natriuretic response to A25 + B35 was not different from the natriuresis evoked by A25 or B35 alone. The response to A100 + B35 was not different from the response to A100, but significantly less than the response to B35 alone (* p< 0.05).

