
Figure 3.
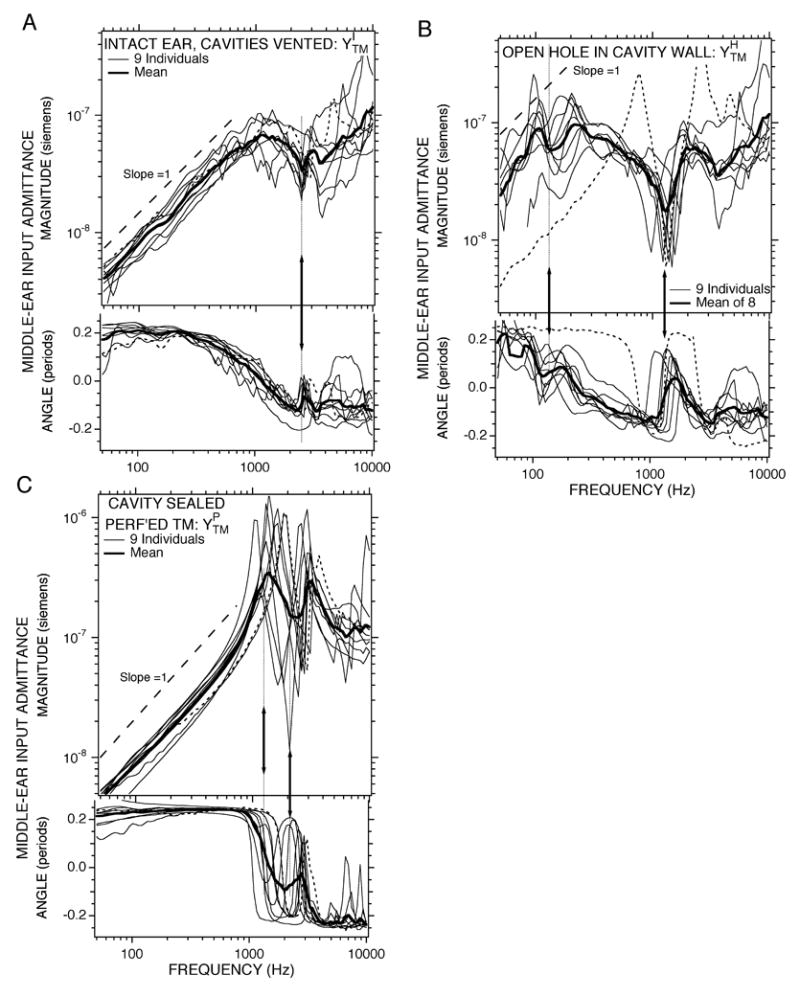
Middle ear input admittance YTM measured with broad-band stimuli under three conditions in 9 ears: (A) : intact the middle-ear cavities are sealed and vented, (B) : open hole in the cavity wall, (C) : perforated TM with the cavity sealed. The thin lines are from individual ears, while the thick dark line shows the mean of the individuals. The thin dotted data lines are from Ear #102. Each panel contains a plot of magnitude (upper plot) and phase angle (lower plot) vs. frequency. The magnitude is scaled in acoustic siemens, where 1 S = 1 m3-s−1-Pa−1. The dashed lines and arrows in each panel are described in the text.