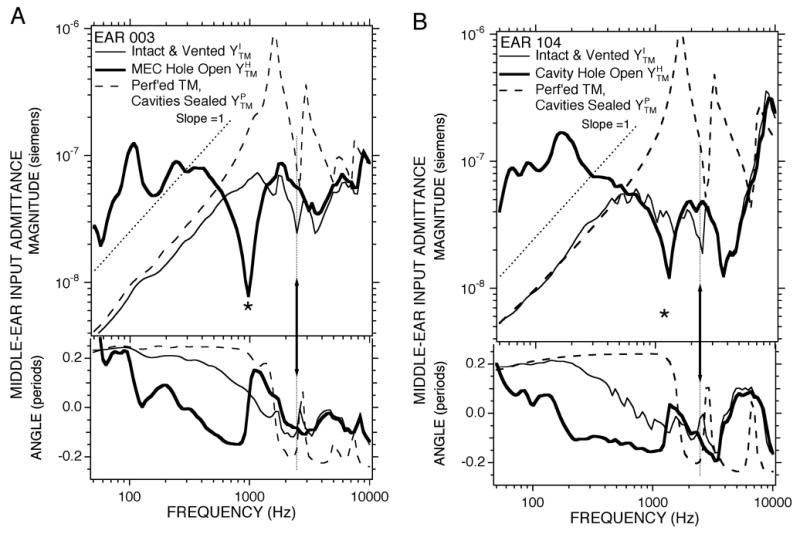
Figure 4.

Middle ear input admittance YTM measured with broad-band stimuli under three conditions in 2 ears. Each panel shows measurements in a single ear. (A) Ear 004. (B) Ear 104. The thinner solid lines shows results from the intact condition. The thicker solid line shows results from the open cavity hole condition. The dashed lines shows results from the perforated TM condition. The thin dotted lines describe log-log slopes of 1. The arrows point to features associated with a middle-ear cavity antiresonance. The *s mark features associated with a cavity-hole antiresonance.
