
Figure 3.
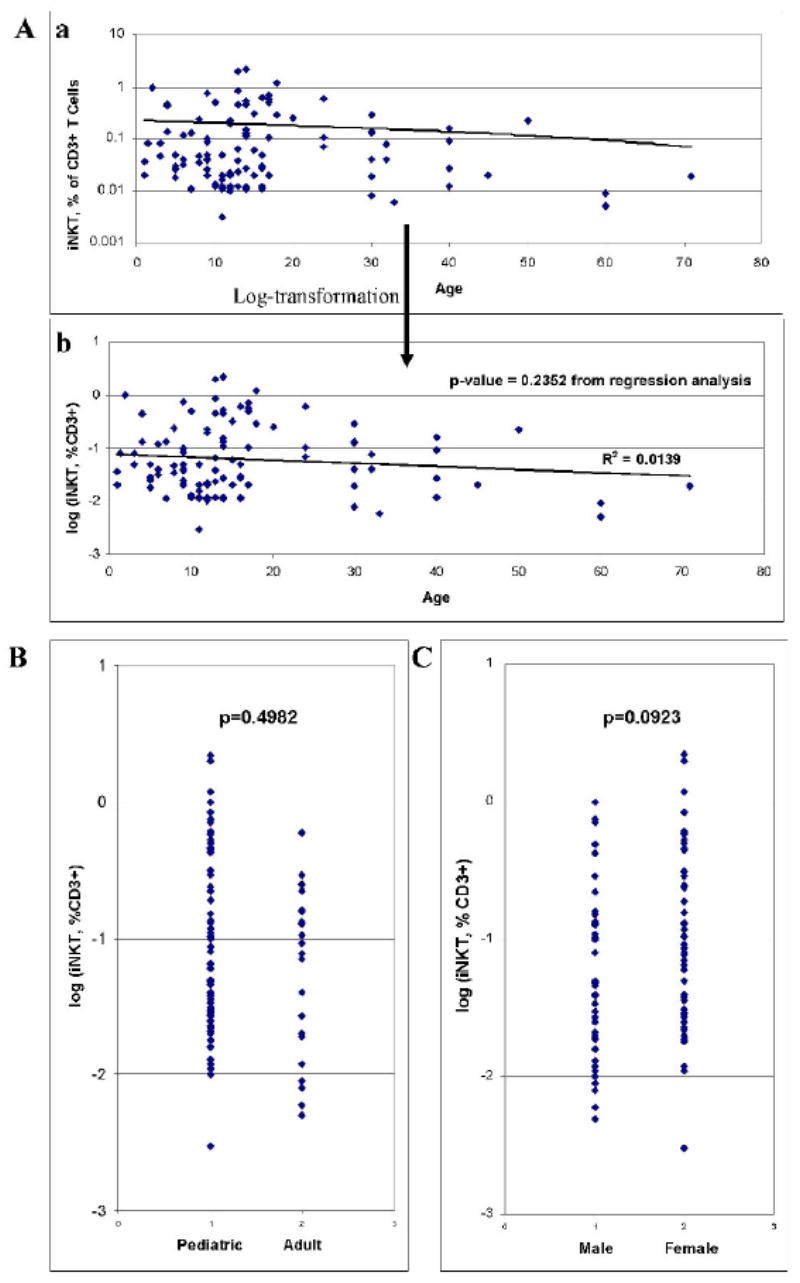
A. Results of iNKT cell analysis plotted in relation to age (a), and also shown after log-transformation (b). B. Results of iNKT cell control group analysis with comparison between pediatric (age 1-18) and adult (age 19 and up) groups. C. Results of iNKT cell control group analysis with comparison between genders.