
Figure 4.
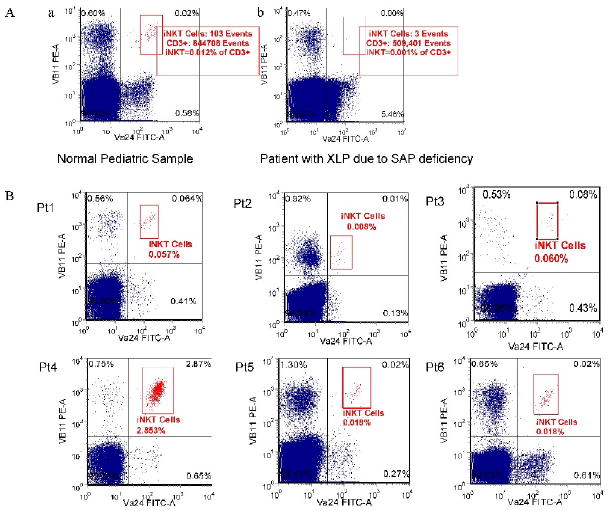
Aa. Sample scatter plot of the iNKT cell population in a control sample possessing low normal levels of iNKT cells (0.012%). Ab. Sample scatter plot of the (absence of) iNKT cell population in a patient with XLP due to SH2D1A mutation (0.001% or absence of iNKT cells). B. Sample scatter plots of iNKT cell populations among 6 patients with XLP due to BIRC4 mutation (designated as Pt1-6).