
Figure 5.
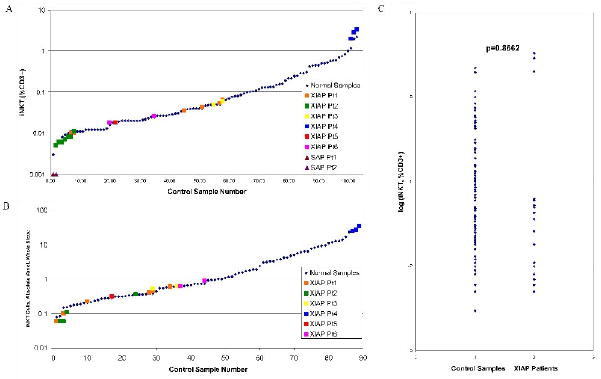
Results of iNKT cell analysis among patients with XLP due to BIRC4 mutation (designated as XIAP Pt1-6) and controls. Pt1 was studied 6 times over the course of 4 months. Pt2 was studied 7 times over the course of 6 months. Pt3 was studied twice during 1 month. Pt4 was studied 3 times over the course of 6 months. Pt5 was studied once. Pt6 was studied twice during 1 month. A. Patient results are shown overlaid onto graphical representation of the control samples, expressed as % of CD3+ T cells. Results from 2 patients with XLP due to SH2D1A mutation are also shown (SAP Pt1-2). B. Patient results are shown overlaid onto graphical representation of the control samples, expressed as number of iNKT cells per microliter of whole blood. C. Comparison of iNKT cell populations of patients (more than 1 result per patient) and control group (1 result per control sample). The log-transformed data are shown. Data were compared using a mixed effects model analysis (p-value = 0.8562).