
Figure 23.
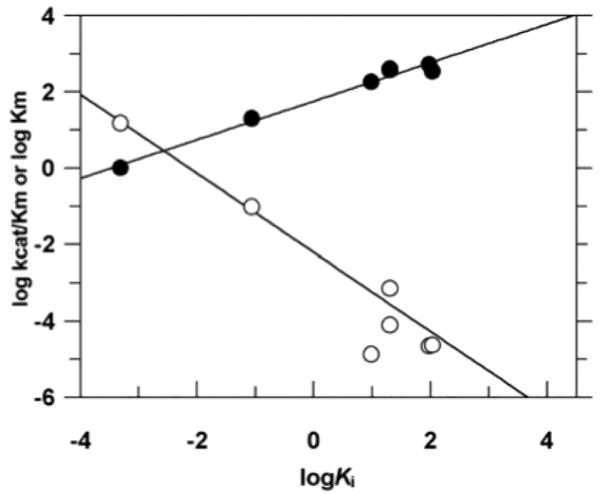
Linear free energy correlations for binding of the methylphosphonate substituted 1-azadeoxyribose analogues and deoxyuridine substrates111. The empty circles show the correlation between log kcat/Km for the methylphosphonate -substituted substrates and log KD for the corresponding methylphosphonate substituted 1-azadeoxyribose analogues. The slope of the line is −1. The filled circles show the correlation between log Km for the methylphosphonate -substituted substrates and log KD for the corresponding MeP-substituted 1-azadeoxyribose analogues. The slope of this line is 0.5.