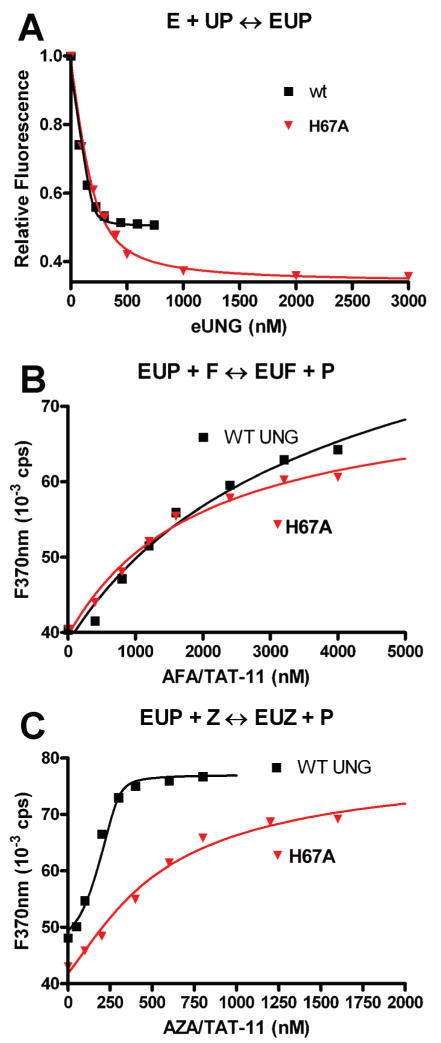
Figure 6.
Binding of P, F, and Z duplexes to wild-type and H67A eUNG–uracil complexes at pH 8.0. (A) Binding of the P duplex to the wild type and H67A. The signal is the decrease in 2-aminopurine fluorescence upon binding of P to the EU complex ([E] = 0.3 μM, [P] = 0.2 μM, and [U] = 1 mM). The curves are the best fits to eq 2. (B) Displacement of P from the EU complexes by F. (C) Displacement of P from the EU complexes by Z. Curves in panels B and C are from computer simulations using Dynafit (see the text).

