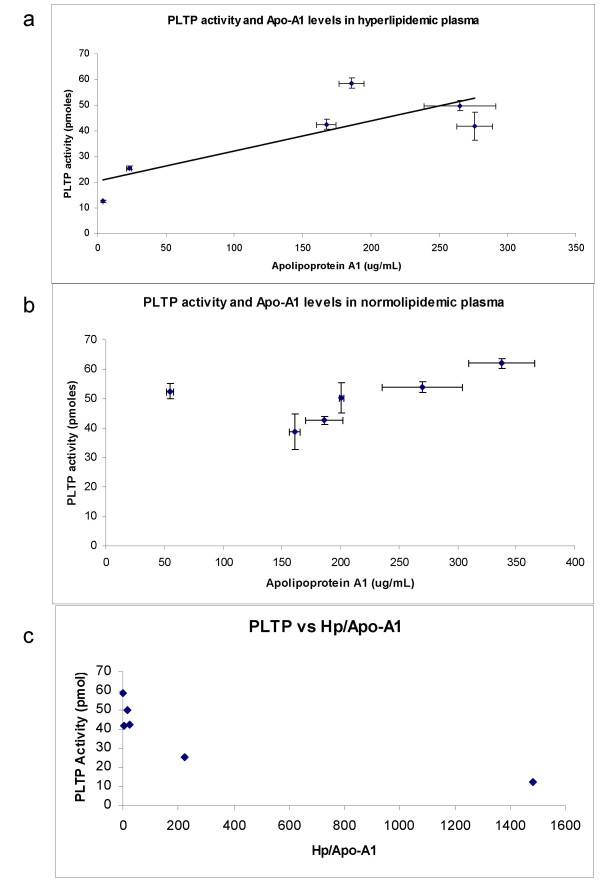
Figure 2.
a. Association between Apolipoprotein A1 levels and PLTP activity (60 min) in hyperlipidemic plasma. Apolipoprotein levels were determined using an EIA kit as outlined in Materials and Methods. Each plasma sample was analyzed in two independent experiments, with at least two replicates per experiment. The graph depicts the mean ± standard deviation (R2 = 0.6635, n = 6, p < 0.05). b. Association between Apolipoprotein A1 levels and PLTP activity (60 min) in normolipidemic plasma (R2 = 0.2732, n = 6, p > 0.05). c. Association between PLTP activity (60 min) and Hp/Apo-A1 ratio in hyperlipidemic plasma (R2 = 0.69, n = 6, p < 0.05).

