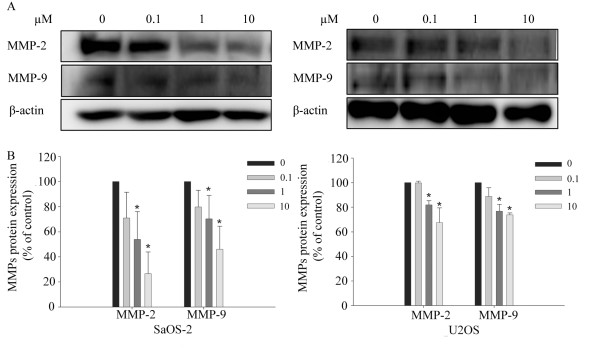
Figure 5.
Risedronate reduced the expressions of MMP-2 and MMP-9 proteins in SaOS-2 and U2OS cells. (A) Cells were treated with the indicated concentrations of risedronate for 48 h, and then cell lysates were Western blotted. Beta-actin was used as a loading control. Images are representative of three independent experiments. B shows MMPs protein levels (expressed as percentages of controls) (n = 3). Numbers in the box represent the concentration of risedronate in μM added to the cells. Bars represent MMPs protein levels (expressed as percentages of controls) of each band ± standard deviation.

