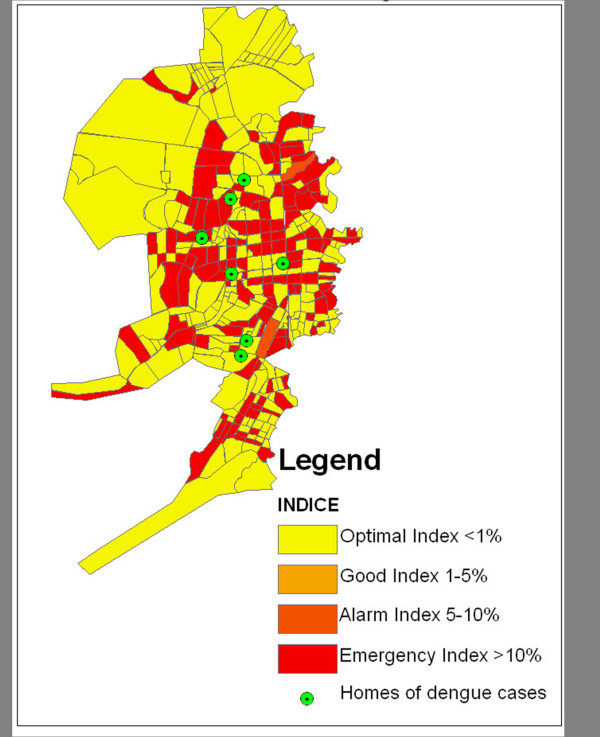
Figure 6.
Bluefields, Nicaragua with Suspected Cases from January 2009 overlaid on indices of infestation by neighborhood block. Suspected cases of dengue are cases with clinical symptoms of dengue that are awaiting serologic confirmation. Yellow areas indicate optimal control, with home indices less than 1%, light orange areas indicate good control, with home indices between 1–5%, dark orange areas indicate alarm levels with indices of 5–10%, and red areas indicate emergency levels with home indices greater than 10%. The cases are shown in green and generally correlate spatially with the locations of high indices of infestation.

